Lorem ipsum dolor sit amet, consectetur adipiscing elit. Vivamus vehicula, diam vitae viverra eleifend, dolor elit sollicitudin tortor, non ullamcorper urna turpis ac arcu. Duis nec dolor faucibus ante ornare porta. Cras vehicula nec elit ut maximus. Nunc gravida sem tincidunt libero consectetur commodo. Aenean et placerat est. Vivamus hendrerit vestibulum consequat. Etiam mattis diam eget rutrum lobortis. In aliquam velit eu lectus lacinia, vitae tempor justo maximus. In id augue ut felis rhoncus elementum.
What is Fathom Intelligence?
Vestibulum sit amet ex et dui bibendum ornare. Sed in dolor interdum, tempor tellus ut, aliquam massa. Nunc hendrerit nisl quis elit maximus, sed malesuada odio molestie. Fusce nec ultricies velit. Nunc lacinia urna a est accumsan egestas. Etiam semper nec ligula sit amet accumsan. Phasellus tristique arcu urna, eu euismod tellus congue ut. Pellentesque finibus at dui nec ornare. Donec finibus odio eget nisl placerat lacinia. Proin commodo vulputate lacus. Aliquam id lorem leo. Morbi venenatis sem at sem lobortis, vitae tempor risus faucibus.
Phasellus vestibulum felis in nisl tincidunt, eget tincidunt lectus convallis. Sed enim leo, tristique condimentum augue sit amet, tincidunt vehicula odio. Sed pretium lacus ligula, quis suscipit ex tincidunt eget. Nam a purus nunc. Nam sit amet orci nisi. Etiam lobortis at risus ut ornare. Aliquam tempor nulla nulla, quis eleifend lorem sagittis non.
In malesuada pharetra sem, at maximus nisi lobortis vitae. Fusce arcu libero, tempus ut tempor at, mattis vitae nisi. Ut non leo ut tellus gravida pulvinar ac eu leo. Proin fringilla sapien sem, vel rutrum orci efficitur ac. Vestibulum venenatis pellentesque tellus, sed fermentum turpis tempor non. Duis ipsum justo, rutrum id bibendum sed, suscipit et quam. Nullam sed enim tincidunt, mattis velit a, tristique metus. Mauris eget nulla dui. Aenean suscipit est ante, a vehicula felis ornare eu. Curabitur dictum odio lorem, at commodo diam sodales ac.
Praesent vitae eros eu odio consequat iaculis bibendum sed nunc. Cras semper eget nisl at cursus. Duis bibendum sodales lacus, ac malesuada nunc sollicitudin varius. Phasellus sit amet tristique orci. Vestibulum mattis est at finibus facilisis. Donec tincidunt tortor nec velit placerat ornare. Curabitur porta dictum nulla, ac tristique nulla commodo vel. Integer vulputate in neque id elementum. Donec porttitor odio arcu, non fringilla metus feugiat non. Donec non vestibulum risus, id iaculis nibh. Nunc varius mattis lacus, ut pretium est elementum sit amet. Suspendisse consectetur sit amet augue vel condimentum. Morbi tempu
Is Fathom Intelligence for me?
Lorem ipsum dolor sit amet, consectetur adipiscing elit. Vivamus vehicula, diam vitae viverra eleifend, dolor elit sollicitudin tortor, non ullamcorper urna turpis ac arcu. Duis nec dolor faucibus ante ornare porta. Cras vehicula nec elit ut maximus. Nunc gravida sem tincidunt libero consectetur commodo. Aenean et placerat est. Vivamus hendrerit vestibulum consequat. Etiam mattis diam eget rutrum lobortis. In aliquam velit eu lectus lacinia, vitae tempor justo maximus. In id augue ut felis rhoncus elementum.
Ready to get started?
Find out how to build and serve your first code in
Get Started.
1 - Get started
Learn how to get started with Fathom Intelligence, including the available options for deploying own code and using notebooks.
1.1 - Functions
Learn how to build and deploy function in Intelligence and use them in other parts of the platform.
TODO: add missing pages, Getting Started guide could serve more as a step-by-step instruction manual on how to use the platform from the UI, enriched with full screenshots and videos to illustrate each action.
1.2 - Notebooks
Learn how to use notebooks, train and deploy models in Intelligence.
1.2.1 - Model deployment
Learn how to deploy models.
Experiments
An experiment is a container that groups related training activities together.
It represents a logical project or task (e.g., “Wine Quality Prediction”).
All runs associated with the same experiment share a common context.
Experiments make it easier to compare different approaches, hyperparameters, or algorithms under one umbrella.
Think of an experiment as a folder that holds all the attempts and results for a specific
Expiriment runs
An experiment run is a single execution of a training process.
Each run records metadata such as parameters, metrics, and artifacts.
Runs are uniquely identified, allowing you to revisit or reproduce them later.
Multiple runs can be executed under the same experiment to test variations (e.g., different learning rates or model architectures).
Runs provide the detailed history of what was tried, how it performed, and what outputs were generated.
Logged models
A logged model is the saved version of a trained model produced during a run.
It includes the model itself along with metadata such as its input/output signature.
Logged models can be stored, versioned, and later deployed into production.
By keeping models tied to their runs, you can trace back exactly how and why a model was created.
This ensures reproducibility and makes it possible to manage multiple versions of models across experiments.
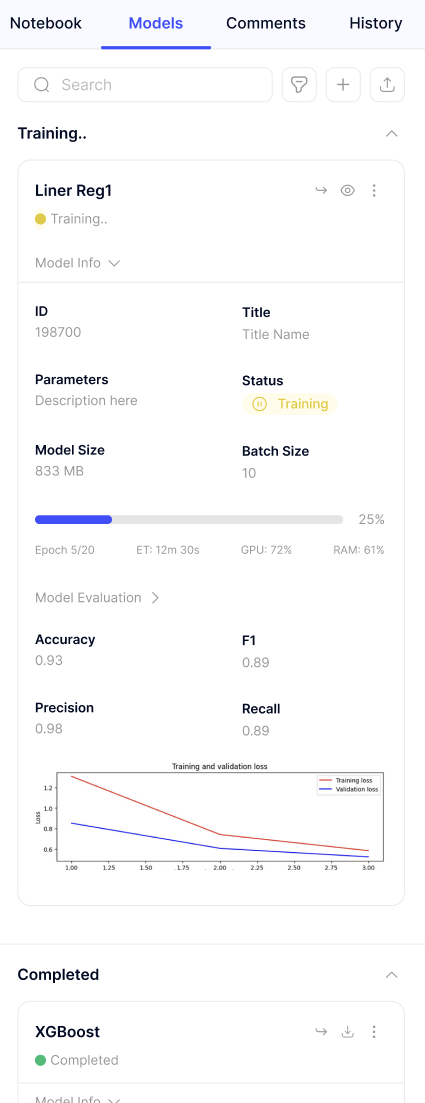
Model Deployments
Once a model has been logged during an experiment run, it can be deployed directly from the platform. Deployment is designed to be simple and automated:
Model selection: Choose the logged model you want to deploy from the experiment history.
Automatic format detection: The platform inspects the model artifact and automatically determines its format (e.g., scikit-learn, TensorFlow, PyTorch).
Seamless deployment: The model is packaged and served on the platform without requiring manual configuration.
Customization options:
Instance size - Select the compute resources that best fit your workload.
Name - Provide a clear identifier for the deployed service.
Description - Add context or notes about the deployment for easier management.
This process ensures that models move smoothly from experimentation to production, with minimal effort and maximum transparency.
TODO: This is just an example how we can inject an image to docs. There we should explain how our UI works.
2 - Technical
Learn how to get started with Fathom Intelligence, including the available options for deploying own code and using notebooks.
2.1 - Installation
This section guides you through the initial setup required to interact with the platform. From a developer or data scientist’s perspective, the CLI serves as the primary bridge between your local code (functions, models) and our platform.
Quick install
The easiest way to install the Intelligence CLI is by running the following command in your terminal. This script automatically detects your operating system and architecture, downloads the latest binary, and adds it to your path.
Download the binary file for your OS (darwin-amd64, darwin-arm64, linux-amd64, windows-amd64) using artifact version from the registry: <version>/<platform>/fathom
Move it to a directory in your $PATH (e.g., /usr/local/bin)
Manual autocompletion setup
If you need to manually generate autocompletion script, use the completion command:
fathom completion <shell>
2.2 - Authentication
Before you can deploy models or manage functions, you must authenticate your local environment. This section describes how to securely link your CLI to the platform organization.
Once the CLI is installed, you need to authenticate with your fathom platform instance.
Prerequisites
Before logging in, ensure you have an account on the platform with an organization already set up.
You will also need projects created for each workspace to fully use the CLI capabilities.
Quick login
To perform an interactive login, run the following command in your terminal:
fathom login <url>
Replace with the actual URL of your Fathom environment (e.g., platform.dev.fthm.io).
Preselect organization and projects
You can optionally provide additional parameters during login if you want the CLI to automatically select your organization and associated projects:
This section explains how to manage various environments seamlessly using a single CLI, ensuring clear separation between development, staging, and production ecosystems.
In the Fathom CLI, a Context represents a specific environment or configuration profile. Instead of logging out and back in to switch between development and production environment, you can use contexts to keep these worlds isolated yet easily accessible.
The Default Context: Upon installation and initial setup, the CLI creates a context named default. Unless specified otherwise, all commands execute within this space.
The Current Context: This is your active environment. Any command you run will apply to this context until you manually switch to another.
Listing Available Contexts
To see which environments you currently have configured and identify which one is active, use the list command:
fathom context list
The output will display all saved contexts, highlighting the one currently selected for use.
Switching Contexts
There are two primary ways to handle multiple environments: temporary overrides and persistent selection.
Temporary Override
If you want to run a single command against a different environment without changing your global settings, use the --context flag:
fathom --context qa intelligence function list
Persistent Selection
To switch your current context across all future terminal sessions, use the select command:
fathom context select qa
Once selected, qa becomes your active environment for every subsequent command until you change it again.
Adding New Contexts
Adding a new environment is straightforward. By combining the --context flag with the login command, the CLI initializes a new profile under the name you provide.
To add a new environment named qa:
fathom --context qa login <url>
After completing the authentication flow, the qa context will be saved and available in your context list. You can then configure its specific organization or project settings independently of your default setup.
2.4 - Functions
This section provides a comprehensive guide on how to develop, build, and manage custom functions within the platform. By leveraging the Fathom CLI, you can transform local code into scalable, platform-hosted logic that integrates seamlessly with your existing data ecosystems.
2.4.1 - Function Management
This document covers the administrative lifecycle of a function. It explains how to provision new function identities, list your existing inventory, and update metadata such as environment variables or scaling parameters.
Listing Functions
To view all functions available in your current context, use the list command. This provides an overview of function names, IDs, and their current configurations.
fathom intelligence function list
Creating a Function
The create command initializes a new serverless function entry on the platform. This step sets the “blueprint” for your function, defining its runtime environment and hardware requirements before you upload any code.
fathom intelligence function create <NAME> [OPTIONS]
Computational resources: small, large, or extra-large.
–auto-create
Optional
Automatically creates a sample application structure for you.
Advanced Configuration Options
Option
Type
Description
–build-env
KEY=VALUE
Environment variables used strictly during the build process.
–serving-env
KEY=VALUE
Environment variables available to the running service.
–serving-gpu
Enum
GPU variant to attach: nvidia-l4 or nvidia-l4-2x.
–serving-timeout
Seconds
Maximum execution time before the function times out.
–schema-input
JSON
JSON schema to validate incoming request data.
–schema-output
JSON
JSON schema to validate outgoing response data.
Example: Simple Python Function
To create a simple python function with sample application code type:
fathom intelligence function create test1 --description 'Just testing' --kind python310 --serving-size small
Next Step
Now that you have created a function resource, you need to sync your local code with the platform.
Proceed to Source Management to learn how to upload your function logic.
Updating a Function
Use the update command to modify an existing function’s configuration. This is commonly used to adjust scaling, update secrets via environment variables, or rename the resource.
fathom intelligence function update <FUNCTION_ID> [OPTIONS]
Option
Requirement
Description
<FUNCTION_ID>
Required
The unique ID of the function you wish to update.
–name, -n
Optional
Update the display name of the function.
–description, -d
Optional
Update the function’s description.
–serving-size, -s
Optional
Change the hardware tier (small, large, extra-large).
–serving-env
Optional
Update or add new runtime environment variables (KEY=VALUE).
–serving-gpu
Optional
Change the GPU variant or attach one to the service.
–serving-timeout
Optional
Adjust the execution timeout in seconds.
Example: Scaling an Existing Function
If your function requires more memory or a longer execution time, you can update it as follows:
fathom intelligence function update 1fc6c0ba-2ab6-4c0d-8a32-3a6374956aa3 --serving-size extra-large --serving-timeout 600
2.4.2 - Source Management
This section focuses on the synchronization between your local development environment and the remote registry. It details the process of pushing your source code to the platform and pulling existing codebases down for collaborative development or version audits.
Initializing Local Source Code
If you created your function using the --auto-create flag, or if the function already contains source code in the registry, you should start by downloading the code to your local machine.
Downloading Code
The download command fetches the function’s source code and places it into a specified directory.
fathom intelligence function download <FUNCTION_ID> <DIRECTORY>
Example
To download a function to a folder named testing:
fathom intelligence function download --id 44b18587-5eb1-4261-a90e-fa6852bc8086 testing
After downloading, your directory (e.g., testing) will typically look like this:
Once you have made changes to your logic or updated the dependencies locally, you must upload the source code back to the platform before it can be built or deployed.
fathom intelligence function upload <FUNCTION_ID> <DIRECTORY>
Usage Note:
The argument should point to the root folder containing your func.yaml or main source files.
This command updates the “Source” state of the function on the platform, but it does not automatically trigger a new deployment. You must run a build and deploy command separately to see the changes live.
Versioning and Revisions
Every time you successfully upload code, the CLI generates a new Revision ID. This ID is used to track different versions of your source code before they are built.
fathom intelligence function upload --id 44b18587-5eb1-4261-a90e-fa6852bc8086 testing
Function source code updated - revision: v1
Next Step
Now that your source code is synchronized with the platform, you are ready to compile your code and push it to a live environment.
Proceed to Build and Deploy to learn how to finalize your function.
2.4.3 - Build and Deploy
This section describes the critical transition from raw source code to a running service. It covers the build system where dependencies are resolved and artifacts are created and the deployment process that promotes a build into a live, accessible endpoint.
Understanding the Build Process
A Build is an immutable artifact created from a specific source code revision (e.g., v1). During this phase, the platform resolves dependencies, compiles your code and prepares the environment for execution.
Creating a Build
The build create command triggers the build process on the platform.
fathom intelligence function build create <FUNCTION_ID> [OPTIONS]
Build Options
Option
Description
–revision, -r
The source revision to build. If omitted, the CLI defaults to the most recent revision.
–auto-deploy, -a
If the build succeeds, the CLI will automatically trigger a deployment.
–watch
Starts an interactive watch mode to track build progress in real-time.
–time
Prepends timestamps to the build output logs.
Example: Build with Auto-Deploy
> fathom i function build create 44b18587-5eb1-4261-a90e-fa6852bc8086
--revision v1
--auto-deploy
--watch
build created: c4c9e7c6-a93e-43a3-ac14-705691c38f72
(... logs)build finished: c4c9e7c6-a93e-43a3-ac14-705691c38f72
Monitoring Builds
Since builds happen asynchronously on the platform, you can monitor their status and logs to troubleshoot any compilation or dependency errors.
Listing Builds
To see the history and status of all builds for your current context:
fathom intelligence function build list
Viewing Build Logs
If a build fails or you want to see the detailed compilation output, use the logs command. Note that you need both the Function ID and the Build ID (which you can get from the list command).
fathom intelligence function build logs <FUNCTION_ID> <BUILD_ID>
Deploying a Build
While --auto-deploy is the most common workflow, you can also deploy a previously “Successfully Built” artifact manually.
fathom intelligence function deploy <FUNCTION_ID> <BUILD_ID>
Manual deployment is useful when you want to roll back to an older, stable build without re-building the entire source.
Next Step
Once your function is successfully deployed, it is ready to handle requests.
Proceed to Interaction to learn how to call your function and monitor its runtime logs.
2.4.4 - Interaction and debugging
This document provides instructions for testing and maintaining your functions post-deployment. It explains how to trigger function logic directly from the CLI with custom payloads and how to stream real-time logs to troubleshoot execution errors or monitor performance.
Once your function is successfully deployed and in a “Running” state, you can interact with it and monitor its execution. This section covers triggering function logic via the CLI and accessing runtime logs.
Invoking Functions
To execute your function and see the result, use the call command group. This allows you to send data to your function and receive the processed output directly in your terminal.
Creating a Call
The call create command triggers the execution of your deployed function.
fathom intelligence function call create <FUNCTION_ID> [OPTIONS]
To read file context stdout can be used:
echo'{}'| fathom intelligence function call create --data - <FUNCTION_ID>
Listing Calls
To see the history of executions, their statuses (e.g., Succeeded, Failed), and execution times:
fathom intelligence function call list <FUNCTION_ID>
Runtime Logs
Debugging a serverless function requires visibility into what happens during execution. The logs command streams the standard output (stdout) and error (stderr) logs from your running instances.
Viewing Function Logs
Unlike build logs, which focus on compilation, these logs show your application’s logic in action (e.g., print statements, caught exceptions, or incoming request traces).
fathom intelligence function logs <FUNCTION_ID>
Real-time Debugging: Keep this command running with --watch option in a separate terminal window while you use call create to see immediate feedback.
Troubleshooting: If a call fails with a generic error, the logs will typically contain the specific stack trace or error message from your code.
Summary
You have completed the full lifecycle of a Fathom Intelligence Function:
Management: Created the resource.
Source: Uploaded your code.
Build/Deploy: Compiled and released the service.
Interaction: Verified the logic and monitored logs.
Need help? Run fathom --help at any time for a full list of global commands.
2.5 - Machine Learning
This section covers the various ways to integrate, deploy, and manage machine learning models within the Fathom platform, ranging from proprietary custom models to pre-trained industry standards.
2.5.1 - Custom Models
This document describes different approaches to accessing and preparing data required for training machine learning models.
2.5.1.1 - Tracking Experiments
Tools to log parameters, metrics, and metadata during the training phase to ensure reproducibility.
Fathom enables seamless experiment tracking by integrating with platform experiment tracking. This allows you to log parameters, metrics, and metadata during your training phase to ensure full reproducibility of your machine learning models.
How It Works
The platform does not require a custom logging library. Instead, it leverages the standard MLflow Python SDK (minimum version 3.5 required).
When you execute your training scripts via the Fathom CLI, the system automatically injects the necessary environment variables and authentication contexts. This ensures that all data logged via the SDK is correctly routed to your organization’s private experiment registry on the platform.
Integrated Workflow: Code & Run
The most efficient way to track an experiment is to write a standard Python script and execute it using the mlflow run wrapper. This ensures that your session is authenticated and linked to the correct project.
Write your Training Script
Create a file (e.g., train.py) using the standard MLflow library. The platform handles the backend connection automatically.
importmlflowimportos# Create experimentmlflow.set_experiment("fraud-detection-v1")# Add or update tags to the created experiment.mlflow.set_experiment_tags({"project_name":"Fraud Prevention","team":"Data Science Core","priority":"High"})withmlflow.start_run():# Log parameters (hyperparameters)mlflow.log_param("learning_rate",0.01)mlflow.log_param("epochs",10)# Log metrics (performance)mlflow.log_metric("accuracy",0.95)mlflow.log_metric("loss",0.05)# You can tag each run under an experiment independently.mlflow:set_tag("version","1.0")# Log the model (Logged Model)# This makes the model visible in the Fathom Model Registry# mlflow.sklearn.log_model(sk_model, "model")print("Run completed and logged to Fathom.")
Local Setup
To quickly prepare your local environment, we recommend using a virtual environment:
To run your script and ensure the MLflow context is correctly injected, use the mlflow run command. This command wraps your execution and handles all backend communication.
fathom intelligence mlflow run <COMMAND>
To execute your local Python script:
fathom i mlflow run python3 train.py
Accessing Results
Metrics and experiment history are accessible via the intelligence platform portal.
Key Benefits
Zero-Config Tracking
The CLI automatically manages MLFLOW_TRACKING_URI and authentication tokens. No need to hardcode credentials or endpoints.
Native SDK Support
Use the tools you already know (Python, Scikit-learn, PyTorch) without custom Fathom-specific logging libraries.
Unified Registry
Models logged during training are immediately visible in the platform and ready for deployment.
Requirements
The Fathom integration requires MLflow SDK version 3.1.4 or higher. Check your version using pip show mlflow.
2.5.1.2 - Model Registry
Centralized versioning and storage for your model artifacts.
The Model Registry is a centralized repository where your trained machine learning models are stored, versioned, and prepared for deployment. Models enter the registry primarily through the mlflow tracking integration.
Registering a Model
To ensure maximum interoperability and performance, we recommend exporting models to the ONNX format. Below is a practical example using a small, public dataset (Iris) to train a model and push it to the Model Registry.
The following script trains a simple classifier and logs it as an ONNX artifact.
importmlflowimportmlflow.onnximportonnximportnumpyasnpfrommlflow.models.signatureimportModelSignaturefrommlflow.types.schemaimportSchema,TensorSpecfromsklearn.datasetsimportload_irisfromsklearn.ensembleimportRandomForestClassifierfromskl2onnximportconvert_sklearnfromskl2onnx.common.data_typesimportFloatTensorType# 1. Prepare data and train a small modeliris=load_iris()X,y=iris.data,iris.targetmodel=RandomForestClassifier(n_estimators=10)model.fit(X,y)input_schema=Schema([TensorSpec(np.dtype(np.float32),[1,4],name="float_input")])output_schema=Schema([TensorSpec(np.dtype(np.int64),[-1],name="label")])signature=ModelSignature(inputs=input_schema,outputs=output_schema)# 2. Convert the Scikit-learn model to ONNX formatinitial_type=[('float_input',FloatTensorType([None,4]))]options={type(model):{'zipmap':False}}onnx_model=convert_sklearn(model,initial_types=initial_type,options=options,target_opset=17)mlflow.set_experiment("test-experiment")# Add or update tags to the created experiment.mlflow.set_experiment_tags({"project_name":"Fraud Prevention","team":"Data Science Core","priority":"High"})# 3. Log to Fathom via MLflowwithmlflow.start_run():# Log hyperparameters for contextmlflow.log_param("n_estimators",10)# You can tag each run under an experiment independently.mlflow:set_tag("version","1.0")# Register the model in the registrymlflow.onnx.log_model(onnx_model=onnx_model,artifact_path="iris_classifier",signature=signature,input_example=X[:1])print("Model successfully pushed to the Fathom Registry.")
Dependencies
To use the example above, ensure you have the conversion libraries installed in your environment:
pip install skl2onnx onnxruntime
Why Signatures Matter
A missing or incorrect signature is the most common cause of Deployment Failures. The platform requires exact tensor specifications (dtype and shape) to prepare the serving infrastructure.
Version Compatibility
Unsupported model IR version?
If your deployment fails with an “Unsupported IR version” error, it means your local onnx library is newer than the platform’s runtime.
Fix: Always specify target_opset=17 (or lower) when converting models to ONNX to ensure compatibility with the production Inference Engine.
Dimension Mismatch (1 vs 2)
If your deployment fails with a “1 dimension vs 2” error, it means the auto-batching logic is conflicting with your flat ONNX model.
Fix: Set the first dimension of your input to a fixed number (e.g., 1) in the TensorSpec. This disables implicit batching, allowing the engine to map your 1D model correctly.
Naming Convention
The default output name for Scikit-learn classifiers in ONNX is label. Ensure your output_schema uses this exact name. Using custom names like output_label will result in an Invalid argument error during inference.
Execution
Run the script using the Fathom CLI to ensure the registry context is correctly injected:
fathom intelligence mlflow run python3 train_onnx.py
Listing models
Once the script finishes, you can confirm that the model was received and stored correctly by querying the platform’s model list. This ensures your model is now an immutable asset ready for deployment.
fathom intelligence machine-learning model list
2.5.1.3 - Model Deployment
The process of wrapping your models into scalable, production-ready endpoints.
Model Deployment is the final step in the machine learning lifecycle. It takes a versioned artifact from the Model Registry and wraps it into a high-performance, scalable endpoint ready to serve real-time predictions.
Deploying a Registered Model
To deploy a model, you need the id of the logged model (which you obtained in the previous step). The deployment process allocates the necessary computational resources (CPU, RAM, or GPU) and sets up the inference runtime.
Create a Deployment
Use the deployment create command to launch your model. You must specify the model ID and the desired serving size.
fathom intelligence machine-learning deployment create logged-model --model-id 6174cc98-55fb-4818-9370-f75cafade62e --name "iris-classifier" --description "Production endpoint for Iris flower classification" --serving-size small
Option
Requirement
Description
–model-id
Required
The UUID of the model from the registry.
–name
Required
A unique name for your deployment.
–serving-size
Optional
Resource tier: small, large, or extra-large.
–serving-gpu
Optional
Attach a GPU for heavy models (nvidia-l4, nvidia-l4-2x).
Tag deployment
Use the deployment tag to tag your deployment. You must specify the deployment ID. It is possible to remove tags using deployment untag.
Monitoring Deployment Status
Deployments happen asynchronously. After creating one, you should monitor its state to ensure it transitions to running:
fathom intelligence machine-learning deployment list
Output example of a command run with --watch option:
 id                                   | created_at                     | name                 | kind                                       | description                                        | status  | state | tags
--------------------------------------+--------------------------------+----------------------+--------------------------------------------+----------------------------------------------------+---------+--------------
 379f103f-45cd-4c00-aec3-0fa4af756cae | 2026-03-25 08:06:17.003811 UTC | iris-classifier      | logged-models                              | Production endpoint for Iris flower classification | pending | N/A | production

 id                                   | created_at                     | name            | kind          | description                                        | status  | state | tags |
--------------------------------------+--------------------------------+-----------------+---------------+----------------------------------------------------+---------+---------------
 379f103f-45cd-4c00-aec3-0fa4af756cae | 2026-03-25 08:06:17.003811 UTC | iris-classifier | logged-models | Production endpoint for Iris flower classification | running | hot   | production |
Resource Sizing
For the Iris Classifier (ONNX), a small serving size is more than sufficient. Choose large or attach a GPU only for complex models.
Updating a Deployment
Once a deployment is running, you can update it to point to a new version of your model (e.g., a newly trained logged-model-id) or change its resource allocation (e.g., upgrading from small to large).
The platform performs a rolling update, ensuring that your endpoint remains available while the new model version is being provisioned.
Once your deployment is in the running and hot state, you can begin making predictions. Fathom Intelligence supports three primary inference modes depending on your model type: General Tensor Inference, Chat Completions, and Embeddings.
General Tensor Inference (V2 Protocol)
This mode is used for classic ML models (Scikit-learn, ONNX, XGBoost) and computer vision. It follows the NVIDIA Triton V2 Predict Protocol.
Pipe via Standard Input (Recommended for Scripts)
You can pipe a JSON payload directly into the CLI. This is ideal for integration with tools like jq or automated data pipelines.
MLflow ONNX Models (like the Iris Classifier we registered earlier) strictly support the Triton Inference Protocol via the infer command.
Generative commands like chat and embed are reserved for LLMs and specialized transformers (e.g., from Hugging Face), which will be covered in the following sections.
Developer Resources
Ready to integrate these models into your code? Check out our API Integration Guide for detailed documentation on endpoints, authentication headers, and code examples in Rust and Python.
2.5.2 - Hugging Face Models
A specialized guide on how to leverage the vast library of open-source models from Hugging Face.
For Large Language Models (LLMs) and Text Embedding models, Fathom Intelligence provides a direct integration with Hugging Face. This allows you to skip the Model Registry and deploy industry-standard models with a single CLI command.
You can deploy any supported model by providing its Hugging Face repository ID (e.g., mistralai/Mistral-7B-v0.1). The platform automatically handles the weights download, environment setup, and API wrapping.
Chat Model
For conversational AI, Fathom Intelligence supports Instruct models. Unlike base models that simply “complete” text, Instruct models are fine-tuned to follow directions and maintain a dialogue. When deployed, these models expose an OpenAI-compatible API, allowing you to use them as a drop-in replacement for existing AI integrations.
Once the deployment status reaches Running / Hot, you can interact with the model using the chat command. This command automatically handles the complex formatting (roles like user and assistant) required by the model’s internal chat template.
fathom intelligence machine-learning deployment chat <DEPLOYMENT_ID> --prompt "Explain the concept of 'Open Source' in one sentence."
Embedding Model
Fathom Intelligence allows you to bypass the manual model registration process for industry-standard architectures. You can deploy models directly from the Hugging Face Hub using their repository ID.
To start, we will deploy a lightweight but high-performance embedding model. This model converts text into 384-dimensional vectors.
fathom intelligence machine-learning deployment create hugging-face --model-id "sentence-transformers/all-MiniLM-L6-v2" --name "tiny-embed" --description "Small embedding model for testing" --serving-size large
The embed command is designed for models that perform Feature Extraction (e.g., BERT, RoBERTa, BGE). It converts raw text into high-dimensional numerical vectors (embeddings), which are essential for semantic search, clustering, and Retrieval-Augmented Generation (RAG).
fathom intelligence machine-learning deployment embed <DEPLOYMENT_ID> --input "The quick brown fox jumps over the lazy dog"
The command returns a JSON object containing the vector (embedding) for your input. For a standard model like all-MiniLM-L6-v2, the output will look like this:
Ready to integrate these models into your code? Check out our API Integration Guide for detailed documentation on endpoints, authentication headers, and code examples in Rust and Python.
2.5.3 - Managed LLMs
This section describes how to access and configure Large Language Models (LLMs) managed directly by the platform. It focuses on rapid integration, prompt engineering via API, and cost-efficient scaling without the overhead of infrastructure management.
The Managed LLMs service provides a unified interface to access Large Language Models provided natively by the platform, as well as external models running as a service (such as OpenAI, Claude, or Gemini).
Access and Permissions
To ensure security and cost management, access to these models is governed by API keys managed at two levels:
Platform Level: Global models provided by the infrastructure.
Organization Level: Custom integrations where organization administrators can plug in their own provider keys.
This architecture allows teams to use state-of-the-art models without managing individual credentials, while administrators maintain full control over which models are available to specific organizations.
Listing Available Models
Before interacting with an LLM, you can list all models currently available in your active context. This list includes both native and third-party models (e.g., gpt-4o, claude-3-5-sonnet).
fathom intelligence llms model list
Chat Completions
The chat command is the primary way to interact with Managed LLMs via the CLI. It is an excellent tool for testing connectivity, validating model behavior, or quickly generating content.
fathom intelligence llms model chat <MODEL_NAME> --prompt <PROMPT_TEXT> [OPTIONS]
Key Options
Option
Default
Description
<MODEL_NAME>
Required
The model ID to use (e.g., gpt-4o, gemini-1.5-pro).
Disables real-time streaming of the response to the terminal.
Example: Basic Interactive Chat
To send a simple query to gemma-3-12b-it:
fathom intelligence llms model chat google/gemma-3-12b-it --prompt 'Explain quantum entanglement in one sentence.'
Example: Advanced System Behavior
You can override the default assistant behavior to act as a specific persona:
fathom intelligence llms model chat Qwen/Qwen2.5-VL-3B-Instruct --system 'You are a senior Rust developer. Provide code examples only.' --prompt 'How do I implement a trait in Rust?' --temperature 0.2
Developer Resources
Ready to integrate these models into your code? Check out our API Integration Guide for detailed documentation on endpoints, authentication headers, and code examples in Rust and Python.
2.6 - Notebooks
This section explains how to run and test code directly in Notebooks, making it easy to experiment, visualize, and prototype.
2.6.1 - Accessing Data for Machine Learning Models
This document describes different approaches to accessing and preparing data required for training machine learning models.
Data - sequences
Retrieving Sequences in Parquet Format
Parquet is a columnar storage format optimized for large-scale data processing. It is widely used in machine learning pipelines due to its efficiency and compatibility with distributed systems.
To access a sequence in Parquet format, you only need to construct the correct URL pointing to the resource. The general pattern is:
The model training section demonstrates how to build, track, and manage machine learning experiments in Python.
Building effective machine learning models requires not only robust algorithms but also a well-structured workflow for experimentation, tracking, and reproducibility. Python has become the de facto language for machine learning due to its rich ecosystem of libraries such as scikit-learn, TensorFlow, PyTorch, and XGBoost, which provide powerful tools for model development across classical and deep learning tasks.
To complement these libraries, MLflow offers an open-source platform SDK to manage the end-to-end machine learning lifecycle. It enables:
Experiment tracking: Logging parameters, metrics, and artifacts for each run.
Model management: Packaging models in a standardized format for deployment.
Reproducibility: Ensuring experiments can be replicated across environments.
Collaboration: Sharing results and models across teams.
Important
The platform has been designed so that you can use MLflow natively, without additional configuration. MLflow integrates seamlessly and transparently with our services.
Dependencies
Before starting model training, ensure that the required Python libraries are installed. These dependencies provide the core functionality for building and tracking machine learning experiments.
Scikit-learn
Run the following command in your notebook:
pipinstallscikit-learnmlflow==3.5.1
Use the following code snippet as a template for training a machine learning model with Scikit-learn:
# Original source code and more details can be found in:# https://www.mlflow.org/docs/latest/tutorials-and-examples/tutorial.html# The data set used in this example is from# http://archive.ics.uci.edu/ml/datasets/Wine+Quality# P. Cortez, A. Cerdeira, F. Almeida, T. Matos and J. Reis.# Modeling wine preferences by data mining from physicochemical properties.# In Decision Support Systems, Elsevier, 47(4):547-553, 2009.importwarningsimportsysimportpandasaspdimportnumpyasnpfromsklearn.metricsimportmean_squared_error,mean_absolute_error,r2_scorefromsklearn.model_selectionimporttrain_test_splitfromsklearn.linear_modelimportElasticNetfromurllib.parseimporturlparseimportmlflowimportmlflow.sklearnfrommlflow.models.signatureimportinfer_signatureimportlogginglogging.basicConfig(level=logging.WARN)logger=logging.getLogger(__name__)defeval_metrics(actual,pred):rmse=np.sqrt(mean_squared_error(actual,pred))mae=mean_absolute_error(actual,pred)r2=r2_score(actual,pred)returnrmse,mae,r2if__name__=="__main__":warnings.filterwarnings("ignore")np.random.seed(40)# Read the wine-quality csv file from the URLcsv_url=("http://archive.ics.uci.edu/ml""/machine-learning-databases/wine-quality/winequality-red.csv")try:data=pd.read_csv(csv_url,sep=";")exceptExceptionase:logger.exception("Unable to download training & test CSV, ""check your internet connection. Error: %s",e,)# Split the data into training and test sets. (0.75, 0.25) split.train,test=train_test_split(data)# The predicted column is "quality" which is a scalar from [3, 9]train_x=train.drop(["quality"],axis=1)test_x=test.drop(["quality"],axis=1)train_y=train[["quality"]]test_y=test[["quality"]]alpha=0.5l1_ratio=0.5experiment_name="wine-classification"existing_experiment=mlflow.get_experiment_by_name(experiment_name)ifexisting_experimentisNone:experiment_id=mlflow.create_experiment(name=experiment_name)else:experiment_id=existing_experiment.experiment_idmlflow.set_experiment(experiment_name)# Add or update tags to the created experiment.mlflow.set_experiment_tags({"project_name":"Fraud Prevention","team":"Data Science Core","priority":"High"})withmlflow.start_run(experiment_id=experiment_id):lr=ElasticNet(alpha=alpha,l1_ratio=l1_ratio,random_state=42)lr.fit(train_x,train_y)predicted_qualities=lr.predict(test_x)(rmse,mae,r2)=eval_metrics(test_y,predicted_qualities)print("Elasticnet model (alpha=%f, l1_ratio=%f):"%(alpha,l1_ratio))print(" RMSE: %s"%rmse)print(" MAE: %s"%mae)print(" R2: %s"%r2)mlflow.log_param("alpha",alpha)mlflow.log_param("l1_ratio",l1_ratio)mlflow.log_metric("rmse",rmse)mlflow.log_metric("r2",r2)mlflow.log_metric("mae",mae)# You can tag each run under an experiment independently.mlflow.set_tag("version","1.0")tracking_url_type_store=urlparse(mlflow.get_tracking_uri()).schememodel_signature=infer_signature(train_x,train_y)iftracking_url_type_store!="file":mlflow.sklearn.log_model(lr,"my-new-model",registered_model_name="ElasticnetWineModel",input_example=train_x.head(1),signature=model_signature,)else:mlflow.sklearn.log_model(lr,"model",signature=model_signature)print("done.")
Script Breakdown
Dataset: Wine Quality dataset from UCI ML repository.
Model: ElasticNet regression (combines L1 and L2 regularization).
Metrics logged: RMSE, MAE, R².
Parameters, metrics, and the trained model are logged automatically.
Creates or reuses an experiment (wine-classification) and stores results there.
Pytorch
Run the following command in your notebook:
pip install torch torchvision mlflow==3.5.1
Use the following code snippet as a template for training a machine learning model with PyTorch:
fromtorch.fftimportTensorfrommlflow.typesimportSchema,TensorSpecimportmlflowimportmlflow.pytorchfrommlflow.modelsimportModelSignatureimporttorchimporttorch.nnasnnimporttorch.optimasoptimfromtorchvisionimportdatasets,transformsfromtorch.utils.dataimportDataLoaderimportnumpyasnpimportlogginglogging.basicConfig(level=logging.WARN)logger=logging.getLogger(__name__)# Transformations for MNIST imagestransform=transforms.Compose([transforms.ToTensor(),transforms.Normalize((0.1307,),(0.3081,))])# Load MNIST datasettrain_dataset=datasets.MNIST('./data',train=True,download=True,transform=transform)test_dataset=datasets.MNIST('./data',train=False,download=True,transform=transform)train_loader=DataLoader(train_dataset,batch_size=64,shuffle=True)test_loader=DataLoader(test_dataset,batch_size=1000,shuffle=False)# Simple neural networkclassNet(nn.Module):def__init__(self):super(Net,self).__init__()self.fc1=nn.Linear(28*28,128)self.fc2=nn.Linear(128,10)defforward(self,x):x=x.view(-1,28*28)x=torch.relu(self.fc1(x))x=self.fc2(x)returnx# Define input schemainputs_schema=Schema([TensorSpec(type=np.dtype(np.float32),shape=(-1,1,28,28))])# Define output schemaoutputs_schema=Schema([TensorSpec(type=np.dtype(np.float32),shape=(-1,10))])# Create the signaturemodel_signature=ModelSignature(inputs=inputs_schema,outputs=outputs_schema)model=Net()optimizer=optim.Adam(model.parameters(),lr=0.001)criterion=nn.CrossEntropyLoss()experiment_name="Testing"existing_experiment=mlflow.get_experiment_by_name(experiment_name)ifexisting_experimentisNone:experiment_id=mlflow.create_experiment(name=experiment_name,artifact_location="mlflow-artifacts:/pytorch-artifacts")else:experiment_id=existing_experiment.experiment_idmlflow.set_experiment(experiment_name)# Add or update tags to the created experiment.mlflow.set_experiment_tags({"project_name":"Fraud Prevention","team":"Data Science Core","priority":"High"})input_example=Falsewithmlflow.start_run():mlflow.log_param("lr",0.001)mlflow.log_param("batch_size",64)forepochinrange(5):# train for 5 epochsmodel.train()train_loss=0correct=0total=0fordata,targetintrain_loader:input_example=data.numpy()optimizer.zero_grad()output=model(data)loss=criterion(output,target)loss.backward()optimizer.step()train_loss+=loss.item()_,predicted=torch.max(output.data,1)total+=target.size(0)correct+=(predicted==target).sum().item()epoch_loss=train_loss/len(train_loader)epoch_acc=correct/total# Log metrics per epochmlflow.log_metric("train_loss",epoch_loss,step=epoch)mlflow.log_metric("train_accuracy",epoch_acc,step=epoch)# You can tag each run under an experiment independently.mlflow.set_tag("version","1.0")print(f"Epoch {epoch+1}, Loss: {epoch_loss:.4f}, Accuracy: {epoch_acc:.4f}")# Save trained modelmlflow.pytorch.log_model(model,"mnist_model",signature=model_signature,input_example=input_example)
Real-Time Feedback During Training
When training a model inside a notebook, you should be informed in real time about:
Training progress: logs and outputs displayed directly in the notebook cells and UI.
Evaluation results: metrics such as RMSE, MAE, or accuracy printed immediately after each run.
Trained model artifacts: confirmation that the model has been saved and registered.
Model deployment
If you believe your model is ready and you would like to deploy it so it can be used in other parts of the platform, please proceed to the Getting Started Model Deployments Section.
2.6.3 - Working with LLMs in Notebooks
Getting started guide for integrating Large Language Models (LLMs) into your notebook workflows.
This documentation explains how to communicate with Large Language Models (LLMs) directly from a notebook environment.
Requirements
Before you start, make sure you have the necessary dependencies installed in your notebook environment.
Install the OpenAI SDK
The OpenAI SDK (openai) is only required if you want to write code in Python and communicate with LLMs via the SDK.
pip install openai
Listing models
Before starting, you may want to see which models are available in your environment. This helps you choose the right model for your task.
This will output a list of model identifiers (e.g., gpt-4.1, gpt-4o-mini, etc.) that you can use in subsequent calls.
Creating chats
Chats allow you to interact with an LLM in a conversational style. You can provide a sequence of messages, and the model will respond accordingly.
fromopenaiimportOpenAIclient=OpenAI(base_url=os.environ.get("FATHOM_SDK_BASE_URL")+"/llms/v1",api_key="",default_headers={"Authorization":os.environ.get("FATHOM_SDK_AUTHORIZATION")},)response=client.chat.completions.create(model="Qwen/Qwen2.5-VL-3B-Instruct",messages=[{"role":"developer","content":"Talk like a pirate."},{"role":"user","content":"How do I check if a Python object is an instance of a class?",},],)print(response)
importrequestsimportosimportjsondata={"model":"google/gemma-3-12b-it","messages":[{"role":"user","content":"What time is it in Poland"}],}response=requests.post(os.environ.get("FATHOM_SDK_BASE_URL")+"/llms/v1/chat/completions",headers={"Authorization":os.environ.get("FATHOM_SDK_AUTHORIZATION")},json=data,)ifresponse.status_code==200:print("Success:")print(json.dumps(response.json(),indent=4))else:print("Error:",response)
Direct Communication with a Custom LLM Endpoint
In some cases, you may want to communicate with an LLM that is not OpenAI-compatible. This usually means the model is hosted on a custom server or API endpoint. Instead of using the built-in chat.completions.create or completions.create methods, you can send requests directly to your endpoint using standard HTTP libraries such as requests.
Important
When listing models, each model also contains a property uris.base. Example value:
/v1/backends/gemini/
This property is the base path you must use to construct the URL for direct communication with the backend. It is only relevant when you want to bypass the SDK and talk directly to the LLM server.
importrequestsimportosimportjsonbackend_uri="/v1/backends/gemini/"# uri retrieved from models listdata={"model":"models/gemini-2.5-flash","messages":[{"role":"user","content":"What time is it in Poland"}]}response=requests.post(os.environ.get("FATHOM_SDK_BASE_URL")+'/llms'+backend_uri+'chat/completions',headers={'Authorization':os.environ.get("FATHOM_SDK_AUTHORIZATION")},json=data)ifresponse.status_code==200:print('Success:')print(json.dumps(response.json(),indent=4))else:print('Error:',response);
2.6.4 - Working with Databases in Notebooks
This page explains how to integrate databases into your notebook workflows.
Deprecation Notice
Warning: Support for custom databases may be removed in the future
Qdrant
Qdrant is a vector database designed for storing and searching embeddings, making it a powerful tool in machine learning workflows. In a notebook context, it allows you to seamlessly manage collections of vectors generated by LLMs, enabling tasks like semantic search or similarity matching. By integrating Qdrant with LLM outputs, you can build intelligent applications that combine natural language understanding with efficient vector-based retrieval.
Requirements
Before you start, make sure you have the necessary dependencies installed in your notebook environment.
Python - Qdrant SDK
pip install qdrant_client
Listing collections
You can list all collections available in your Qdrant instance. This is useful to check which datasets are already stored.
This example creates a collection named my_collection with vectors of size 128 and cosine similarity as the distance metric.
2.7 - Environment variables
Pre-injected environment variables providing automated authentication and project context for all platform Functions and Notebooks.
To streamline development and ensure seamless integration with the platform, every Function and Notebook is automatically injected with a set of predefined environment variables. These variables allow the SDK to authenticate and communicate with the necessary services without manual configuration.
System Variables
Variable Name
Description
Value / Example
FATHOM_SDK_AUTHORIZATION
Security token used for authenticating API requests.
Bearer <redacted>
FATHOM_SDK_BASE_URL
The primary API endpoint for the platform.
https://internal-address/
FATHOM_SDK_SERVICE_PATH_*
Dynamic paths assigned to specific platform sub-services.
/v1/service-name
FATHOM_SDK_ORGANIZATION_ID
The unique id of the organization.
2cbfe270-d195-48ad-aed1-24145924635c
FATHOM_SDK_PROJECT_ID
The unique id of the current project.
20effa8442ea1a309c35e6d9
Important
These variables are injected automatically by the platform runtime. You do not need to define them manually in your deployment configuration.
Accessing Variables
You can access these variables within your code using standard environment lookups:
To accelerate your development workflow, Fathom Intelligence provides a local Development Proxy. This tool allows you to interact with the platform’s API from your local machine exactly as your code would after being deployed to our infrastructure.
Running the proxy locally eliminates the need for manual authentication headers and complex URL construction during development. It bridges your local environment with the cloud platform, providing a seamless transition from local script to production function.
Why use the Proxy?
Zero-Config Auth: The proxy handles authentication with Fathom Intelligence using your CLI’s active session.
Environment Mirroring: Your local code can use the same relative endpoints as it will in the production environment.
Rapid Iteration: Test your Rust functions or Python notebooks against live deployments without re-deploying your code.
Starting the Proxy
To launch the internal proxy, simply run the following command in your terminal. By default, the proxy will attempt to bind to an available random port, but you can also specify a fixed one.
fathom proxy --port 59243
Once started, the CLI will display the local address where the proxy is listening:
The fathom proxy is intended for local development only. When your code is running inside a Fathom Function in production, the platform provides internal routing that mirrors this behavior, but you should never bundle the proxy itself into your production artifacts.
Use Environment Variables
Decouple your code from specific Model Deployments. When writing functions that request inference from a Machine Learning model, never hardcode the Deployment ID directly in your source code. Instead, design your function to read the target ID from an environment variable (e.g., INFERENCE_DEPLOYMENT_ID).
This approach allows you to swap underlying models (e.g., moving from a testing “tiny” model to a production-grade LLM) simply by updating the function’s configuration on the Fathom platform, without the need to modify, recompile, or redeploy your application logic.